FlowDeck
Dashboard-native flow metrics for Jira Cloud: time in status, and aging work in progress measured against your team's own cycle time — as gadgets on the dashboard your team already opens.
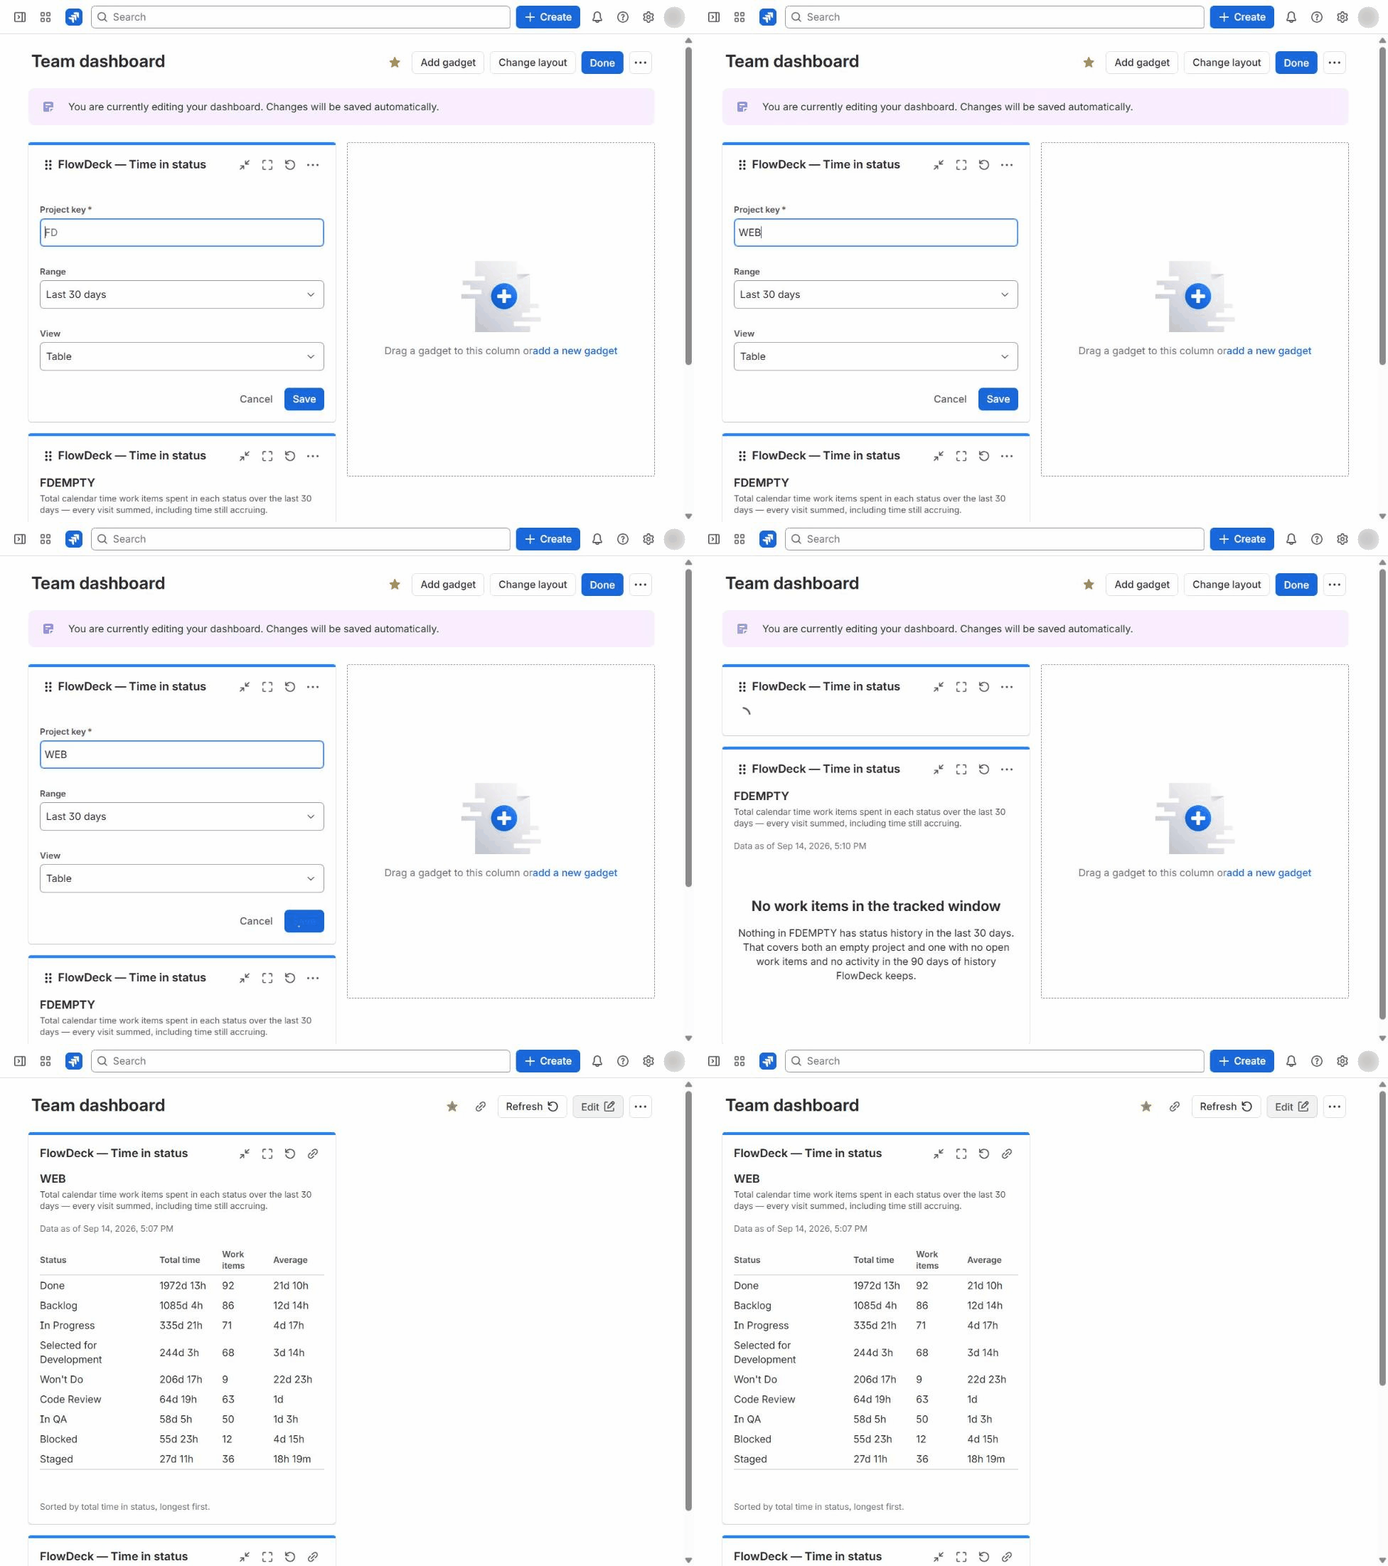
Time in status
Total calendar time work items spend in each status, as a table or bar chart — one project, over the last 30, 60 or 90 days.
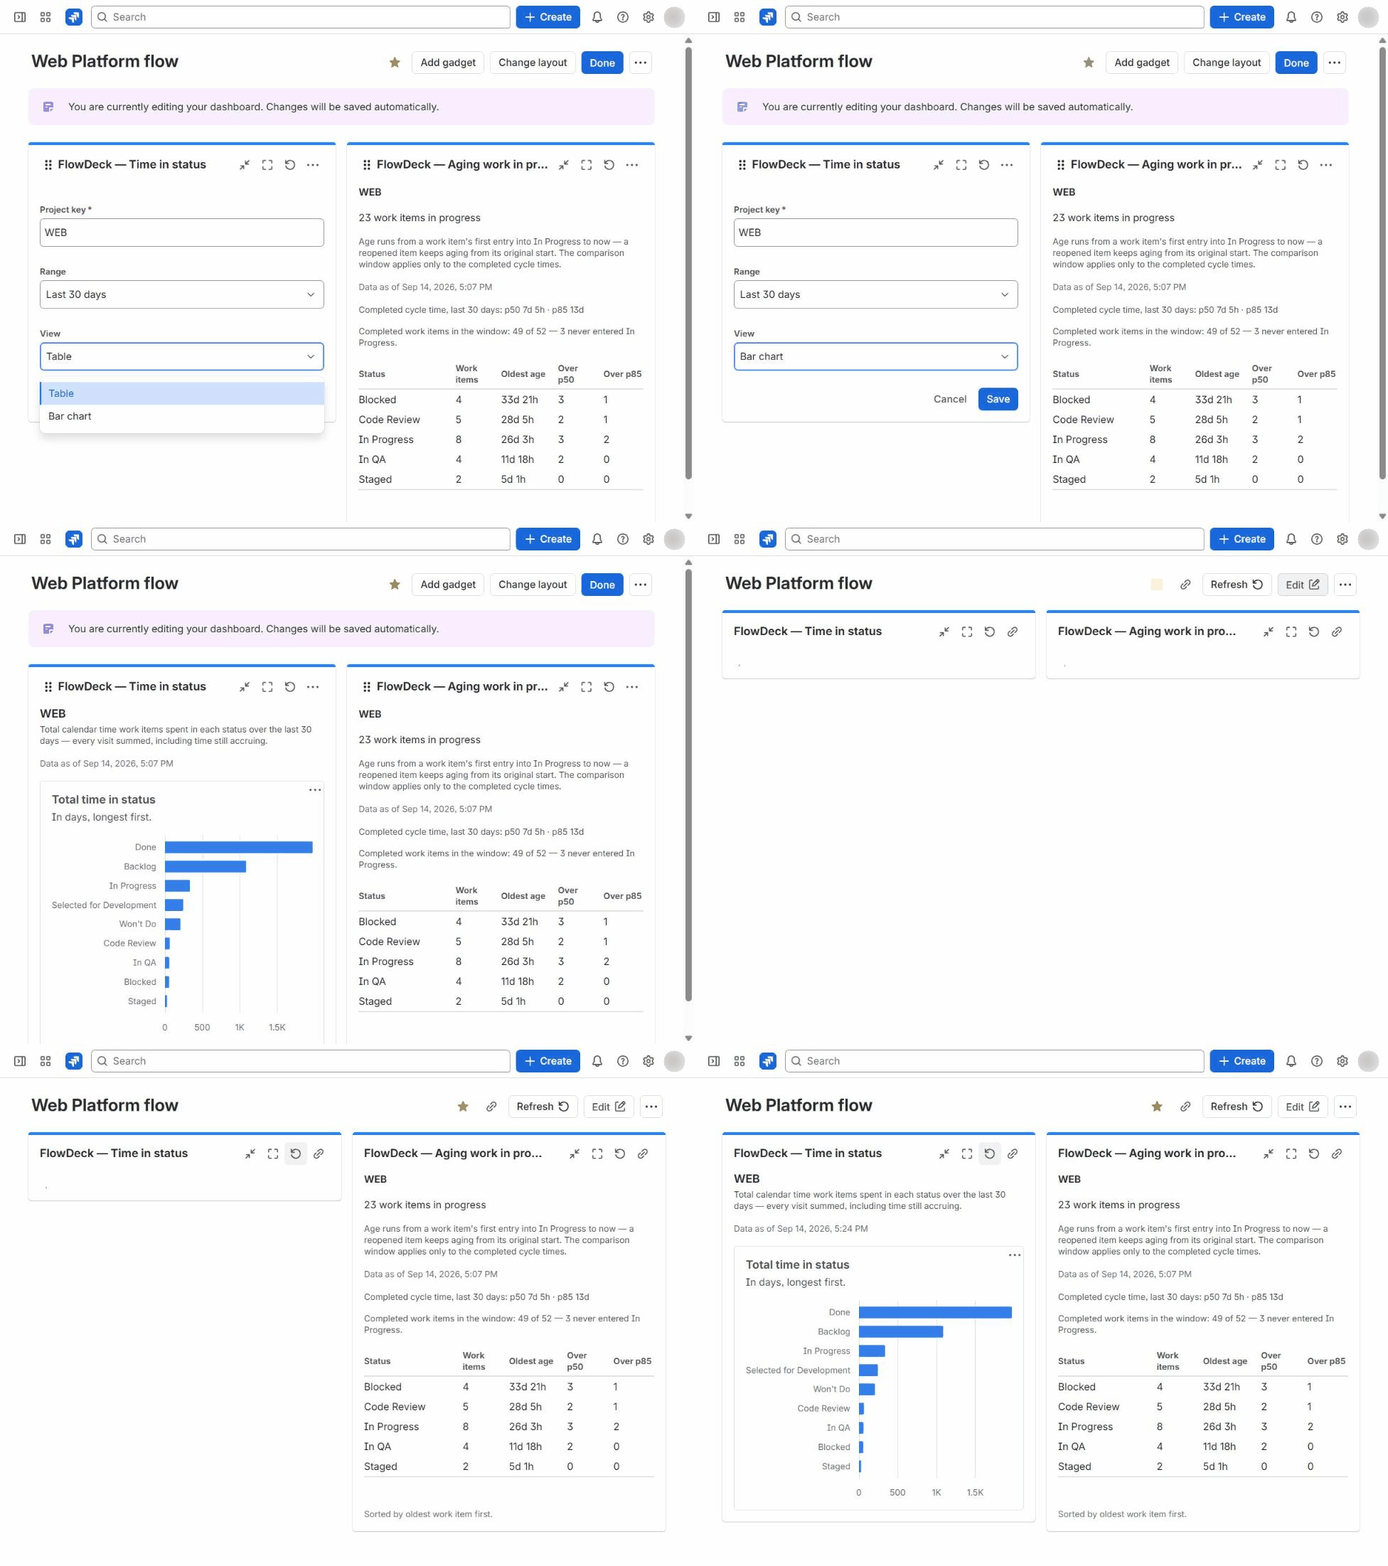
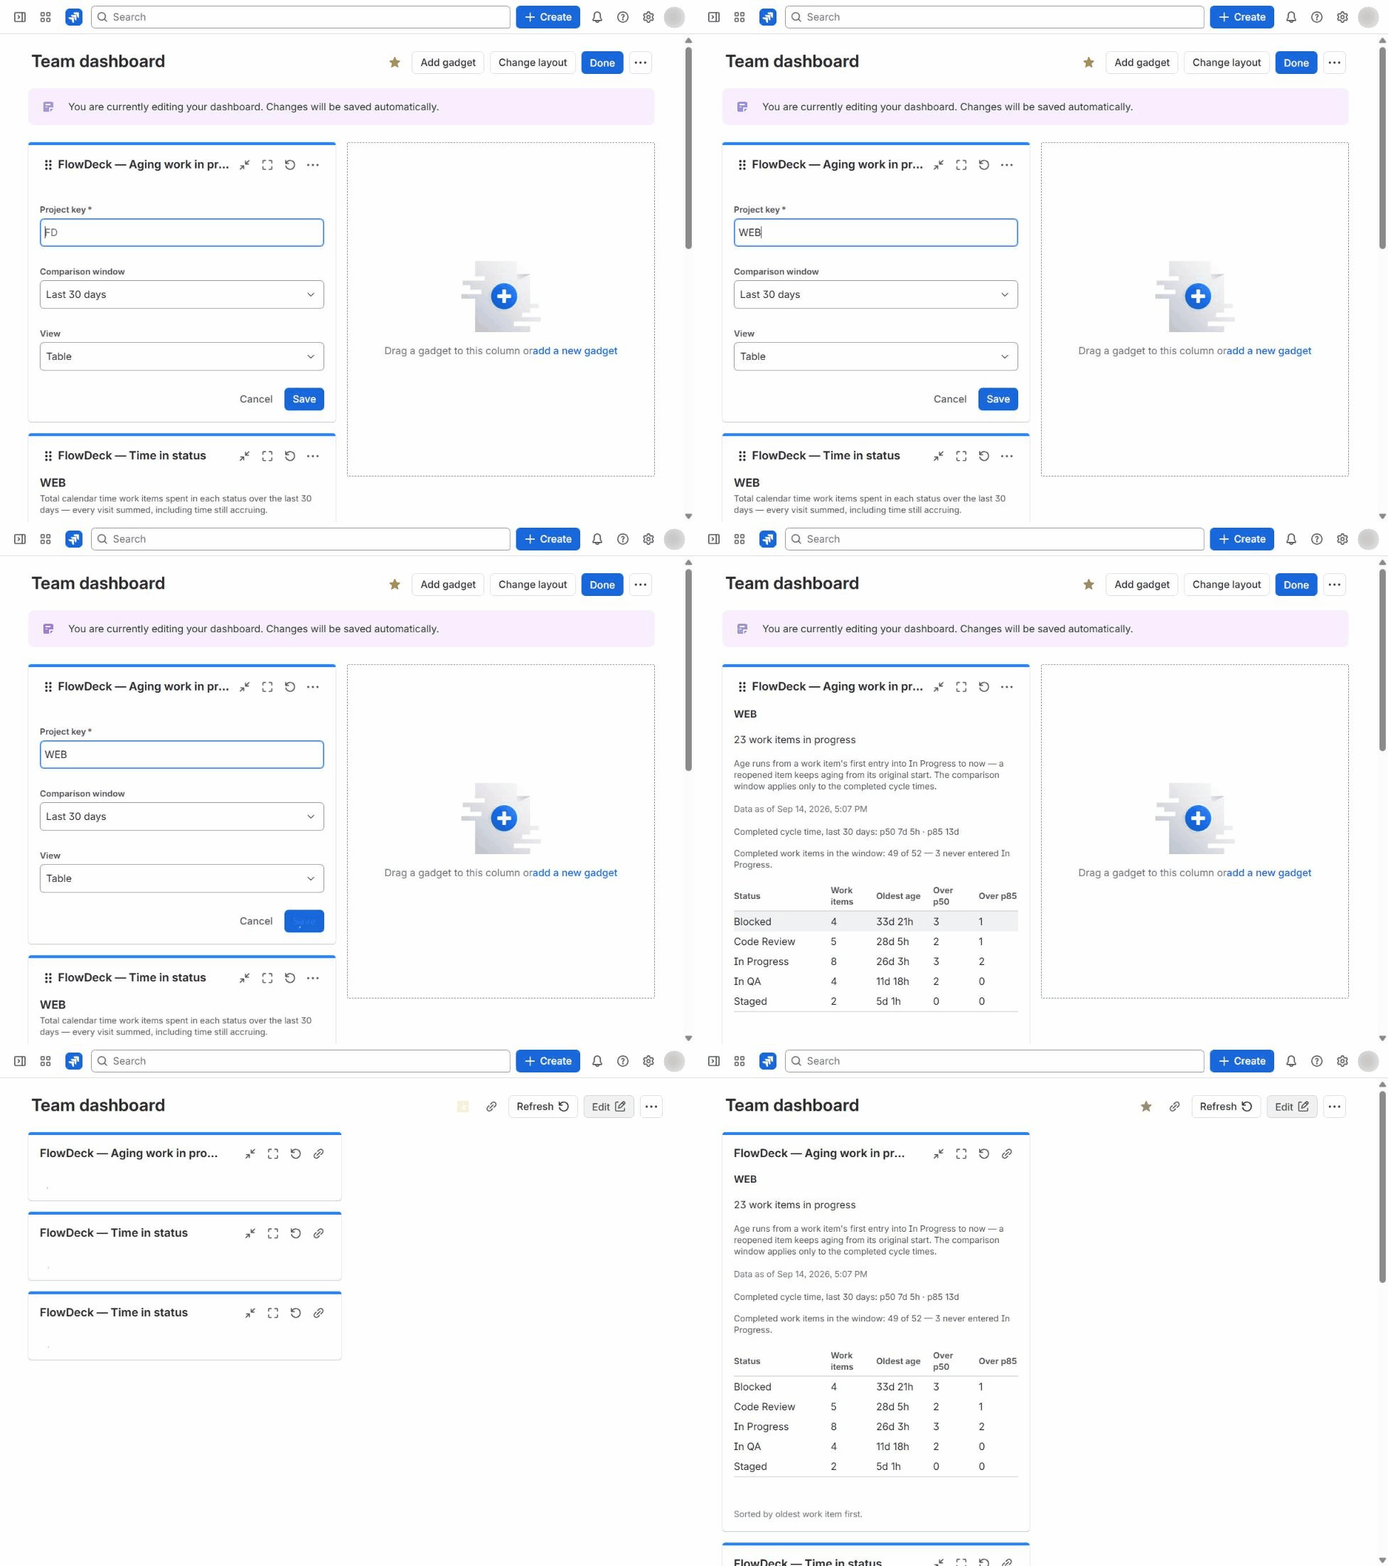
Aging work in progress
How long current work has been in progress, per status, compared with the team's own completed cycle times — one project, aggregates only.